Apps Associates helps design, build, and deploy modern, state-of-the-art data and analytics solutions that can be implemented across a range of vendors including Snowflake, Oracle, Microsoft Azure, and AWS. In addition to possessing world-class implementation expertise even for the most complex and challenging use cases, we also help you with the critical first steps of your data and analytics journey. We work with you to evaluate your current situation, to develop a data strategy, to define a modern data architecture and to define a data and analytics initiative roadmap that reflects your priorities, resource availability and ability to execute. We leverage the latest advancements in AI and Machine Learning to help you move up the Analytics Maturity Curve from descriptive analytics to predictive, prescriptive, and cognitive analytics.
Extensive offerings and a customized approach even for projects that involve 100’s of data sources, complex data engineering and unstructured and semi-structured data are just a few of the reasons Apps Associates is a trusted partner across industries.
More than technology, we are a partner in Data and Analytics
Case Studies
Our Approach

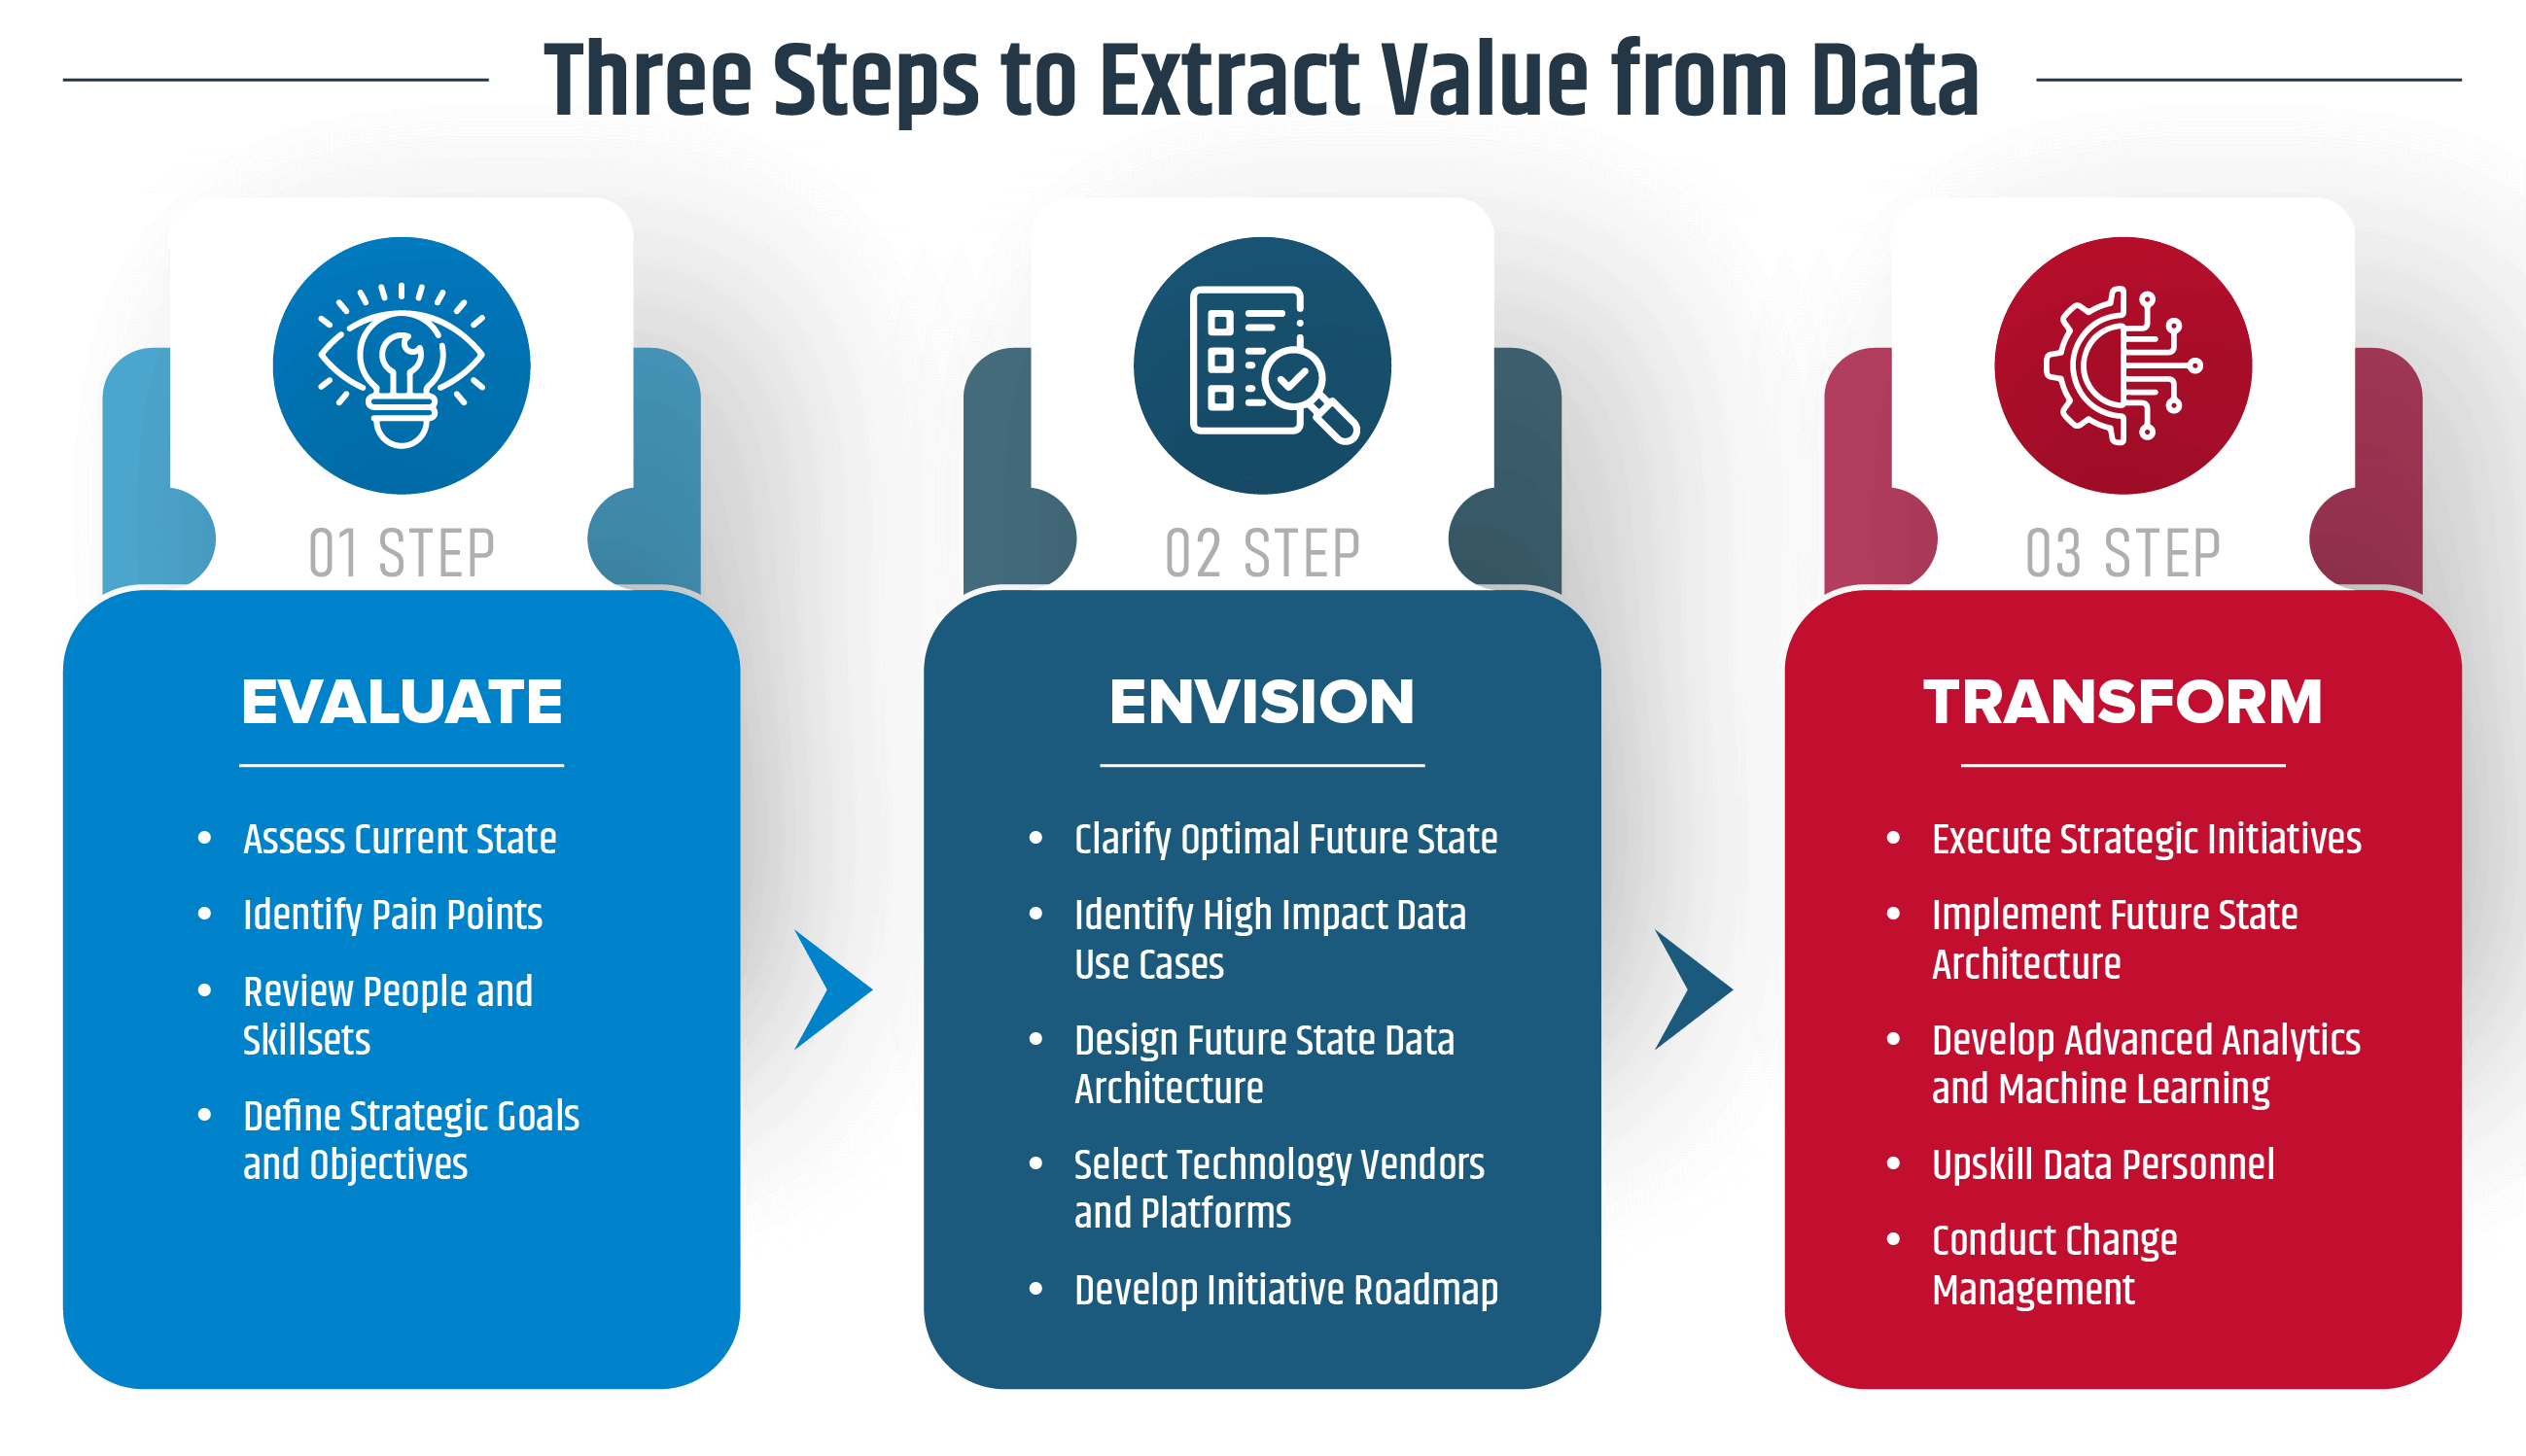
Evaluate, Envision, Transform
All Apps Associates Data and Analytics programs and projects follow our world class three step approach to extracting value from your data. This tried-and-true approach is focused on the following:
- Ensuring your Data and Analytics initiatives are addressing root causes and not just symptoms
- Defining clear objectives and success criteria for your Data and Analytics initiatives
- Aligning future state architectures and capabilities with strategic business objectives
- Evaluating multiple technology platforms and not assuming ‘one size fits all’
- Looking beyond the current project to provide a roadmap for long term analytics success
- Excellence in project execution
- Continuous improvement
A data strategy and modern data architecture are fundamental for organizations looking to harness the power of their data to make informed decisions, drive innovation, gain a competitive edge, and ensure that data is treated as a valuable organizational asset. We craft robust data strategies and modern data architectures that drive business success. With our guidance, you can align data with your goals, enhance data quality, and create a foundation for advanced analytics. Unlock the power of your data with Apps Associates’ expertise.
Read more about our approach and the importance of strategy and architecture for becoming a data-driven organization:
Strategy and Architecture
Ensuring you have the right technology in place to harness the true power of your data is the first step in building a robust data and analytics platform at your organization. We recognize there are a variety of technology choices available in today’s more mature Cloud marketplace and that many companies are not focusing on just one vendor as multi-cloud solutions become more commonplace. To serve our customers better, Apps Associates has partnerships with the top Cloud data and analytics platform providers. Whether it is a single vendor or multi-vendor solution, we make sure you get the benefit of the latest advancements from the major Cloud providers.
Take a look at some more information below, but for a comprehensive understanding of our technology partners or capabilities, contact us today.
- Webinar: Why Oracle Fusion Analytics?
- Blog: Top 5 Questions Customers Ask About Fusion Analytics
- Case Study: Boston Dynamics Pushes IoT-Enabled Commercialization Forward with Snowflake
- Case Study: Apps Associates Implements a Comprehensive Reporting and Analytics Platform for FormFactor, Inc.
Technology Partners
Our technology partners include:


Apps Associates has a number of prebuilt solutions, or accelerators, that are thoughtfully designed to harness the full potential of leading cloud platforms, including Oracle, Snowflake, Microsoft Azure, and AWS. These solutions offer a streamlined path to data-driven success, enabling your organization to accelerate data initiatives with efficiency and confidence. By leveraging these prebuilt solutions, you can swiftly unlock the power of your data, reduce time-to-insight, and drive strategic decision-making. Whether you’re looking to optimize data warehousing, implement advanced analytics, or ensure robust data governance, our comprehensive offerings are your key to achieving transformative results. Please note that there is no license cost for our prebuilt solutions. We offer them free of charge as part of our implementation services. At the end of the project, they become the property of the customer.
Read more about use cases below or talk to our team today to get started on your journey.
- Oracle Fusion Analytics Quick Start Offering
- Oracle On Prem BI (Discoverer, OBIEE, OBIA) to Cloud BI Accelerators
- Analytics Accelerators for EBS, Peoplesoft, JD Edwards and Oracle Fusion Apps
- Snowflake Accelerators
- Amazon Redshift Accelerators
- Azure and Power BI Accelerators
- Healthcare Analytics Accelerators
- Oracle AI and ML Services
- Oracle Analytics Accelerators Consultation
Analytics Accelerators and Quick Starts


